Page 39 - Nuvama | IC Report 2023
P. 39

INDIA: THE 5D ADVANTAGE


                       High debt, adverse demography: A recipe for slow growth
                       Not only are debt levels high globally, but large parts of the world – China and Europe – are staring at
                       demographic deterioration (refer to Demography section). This combination of high debt and adverse   As the real
                       demography is a recipe for a structural slowdown, a la Japan post-1980s. In Japan, as the real estate   estate bubble
                       bubble popped after a debt boom, growth stagnation followed—not just for years but decades. A   popped in Japan
                       shrinking workforce played a role in this dynamic.                                   after a debt boom,
                                                                                                            growth stagnation
                       China finds itself in a similar situation. Like Japan, China’s corporate as well as household sectors are   ensued for decades
                       heavily indebted and its working age population is shrinking. In such a backdrop, cyclical tools for
                       reviving growth (like monetary policy) are ineffective.
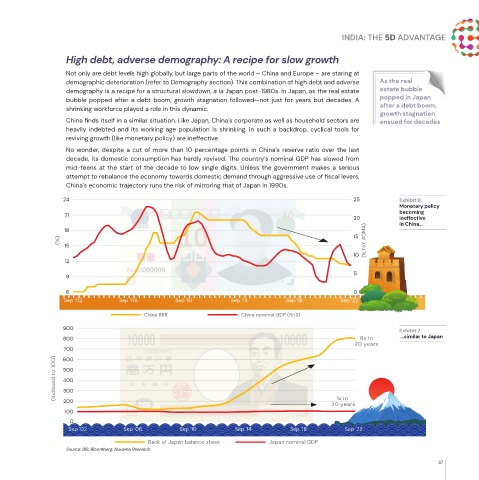
                       No wonder, despite a cut of more than 10 percentage points in China’s reserve ratio over the last
                       decade, its domestic consumption has hardly revived. The country’s nominal GDP has slowed from
                       mid-teens at the start of the decade to low single digits. Unless the government makes a serious
                       attempt to rebalance the economy towards domestic demand through aggressive use of fiscal levers,
                       China’s economic trajectory runs the risk of mirroring that of Japan in 1990s.

                      24                                                                             25          Exhibit 6:
                                                                                                                 Monetary policy
                                                                                                                 becoming
                       21
                                                                                                     20          ineffective
                                                                                                                 in China…
                       18
                                                                                                     15
                     (%)                                                                                (%,YoY 4QMA)
                       15
                                                                                                     10
                       12
                                                                                                     5
                       9
                       6                                                                             0
                       Sep ‘02        Sep ‘06        Sep ‘10        Sep ‘14        Sep ‘18       Sep ‘22
                                            China RRR                  China nominal GDP (RHS)

                      900                                                                                        Exhibit 7:
                      800                                                                              8x in      …similar to Japan
                                                                                                     20 years
                      700
                      600
                    (Indexed to 100)  500
                      400
                      300
                                                                                                1x in
                      200
                                                                                               20 years
                       100
                        0
                        Sep ‘02        Sep ‘06        Sep ‘10        Sep ‘14        Sep ‘18       Sep ‘22

                                             Bank of Japan balance sheet      Japan nominal GDP
                       Source: BIS, Bloomberg, Nuvama Research
                                                                                                                            37
   34   35   36   37   38   39   40   41   42   43   44