
Page 37 - Nuvama | IC Report 2023
P. 37
INDIA: THE 5D ADVANTAGE
Global Economy: Highly indebted
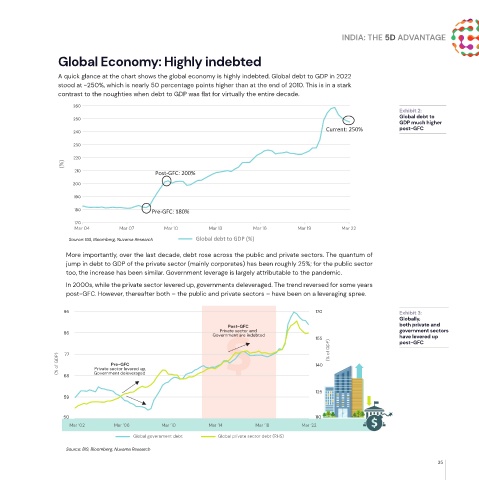
A quick glance at the chart shows the global economy is highly indebted. Global debt to GDP in 2022
stood at ~250%, which is nearly 50 percentage points higher than at the end of 2010. This is in a stark
contrast to the noughties when debt to GDP was flat for virtually the entire decade.
260
Exhibit 2:
Global debt to
250
GDP much higher
Current: 250% post-GFC
240
230
220
(%)
210 Post-GFC: 200%
200
190
180 Pre-GFC: 180%
170
Mar 04 Mar 07 Mar 10 Mar 13 Mar 16 Mar 19 Mar 22
Source: BIS, Bloomberg, Nuvama Research Global debt to GDP (%)
More importantly, over the last decade, debt rose across the public and private sectors. The quantum of
jump in debt to GDP of the private sector (mainly corporates) has been roughly 25%; for the public sector
too, the increase has been similar. Government leverage is largely attributable to the pandemic.
In 2000s, while the private sector levered up, governments deleveraged. The trend reversed for some years
post-GFC. However, thereafter both – the public and private sectors – have been on a leveraging spree.
95 170 Exhibit 3:
Globally,
Post-GFC both private and
Private sector and
86 Government are indebted government sectors
155 (% of GDP) have levered up
post-GFC
(% of GDP) 77 Private sector levered up, 140
Pre-GFC
68 Government deleveraged
125
59
50 110
Mar ‘02 Mar ‘06 Mar ‘10 Mar ‘14 Mar ‘18 Mar ‘22
Global government debt Global private sector debt (RHS)
Source: BIS, Bloomberg, Nuvama Research
35