
Page 38 - Nuvama | IC Report 2023
P. 38
• DE-GLOBALISATION • DEREGULATION • DEBT • DEMOGRAPHY • DEMOCRACY
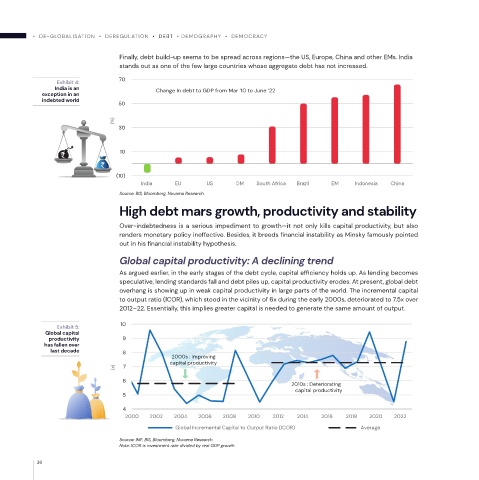
Finally, debt build-up seems to be spread across regions—the US, Europe, China and other EMs. India
stands out as one of the few large countries whose aggregate debt has not increased.
70
Exhibit 4:
India is an Change In debt to GDP from Mar ‘10 to June ’22
exception in an
indebted world
50
(%)
30
10
(10)
India EU US DM South Africa Brazil EM Indonesia China
Source: BIS, Bloomberg, Nuvama Research
High debt mars growth, productivity and stability
Over-indebtedness is a serious impediment to growth—it not only kills capital productivity, but also
renders monetary policy ineffective. Besides, it breeds financial instability as Minsky famously pointed
out in his financial instability hypothesis.
Global capital productivity: A declining trend
As argued earlier, in the early stages of the debt cycle, capital efficiency holds up. As lending becomes
speculative, lending standards fall and debt piles up, capital productivity erodes. At present, global debt
overhang is showing up in weak capital productivity in large parts of the world. The incremental capital
to output ratio (ICOR), which stood in the vicinity of 6x during the early 2000s, deteriorated to 7.5x over
2012–22. Essentially, this implies greater capital is needed to generate the same amount of output.
Exhibit 5: 10
Global capital
productivity 9
has fallen over
last decade 8
2000s : Improving
capital productivity
(x) 7
6
2010s : Deteriorating
capital productivity
5
4
2000 2002 2004 2006 2008 2010 2012 2014 2016 2018 2020 2022
Global Incremental Capital to Output Ratio (ICOR) Average
Source: IMF, BIS, Bloomberg, Nuvama Research
Note: ICOR is investment rate divided by real GDP growth
36