
Page 78 - Nuvama | IC Report 2023
P. 78
• MANUFACTURING • NEW ENERGY • URBANISATION • CONSUMPTION PREMIUMISATION • EQUITY SAVINGS CULT
18
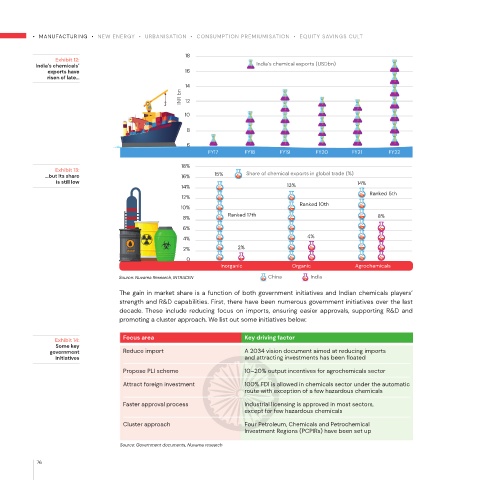
Exhibit 12:
India’s chemicals’ India’s chemical exports (USDbn)
exports have 16
risen of late…
14
INR bn 12
10
8
6
FY17 FY18 FY19 FY20 FY21 FY22
18%
Exhibit 13:
…but Its share 16% 15% Share of chemical exports in global trade (%)
is still low 14%
14% 13%
Ranked 5th
12%
Ranked 10th
10%
Ranked 17th
8% 8%
6%
4% 4%
2% 2%
0
Inorganic Organic Agrochemicals
Source: Nuvama Research, INTRACEN China India
The gain in market share is a function of both government initiatives and Indian chemicals players’
strength and R&D capabilities. First, there have been numerous government initiatives over the last
decade. These include reducing focus on imports, ensuring easier approvals, supporting R&D and
promoting a cluster approach. We list out some initiatives below:
Exhibit 14: Focus area Key driving factor
Some key
government Reduce import A 2034 vision document aimed at reducing imports
initiatives and attracting investments has been floated
Propose PLI scheme 10–20% output incentives for agrochemicals sector
Attract foreign investment 100% FDI is allowed in chemicals sector under the automatic
route with exception of a few hazardous chemicals
Faster approval process Industrial licensing is approved in most sectors,
except for few hazardous chemicals
Cluster approach Four Petroleum, Chemicals and Petrochemical
Investment Regions (PCPIRs) have been set up
Source: Government documents, Nuvama research
76