Page 53 - Nuvama | IC Report 2023
        P. 53
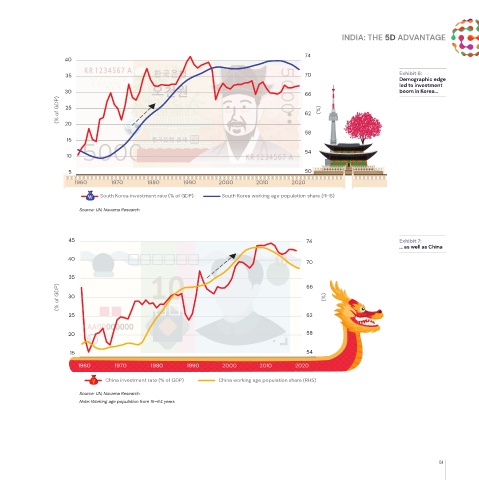
     INDIA: THE 5D ADVANTAGE
                                                                                        74
                       40
                       35                                                               70                       Exhibit 6:
                                                                                                                 Demographic edge
                                                                                                                 led to investment
                       30                                                               66                       boom in Korea…
                     (% of GDP)  25                                                     62  (%)
                       20
                                                                                        58
                       15
                                                                                        54
                       10
                        5                                                               50
                          1960     1970      1980      1990     2000       2010     2020
                                South Korea investment rate (% of GDP)  South Korea working age population share (RHS)
                           Source: UN, Nuvama Research
                        45                                                              74                       Exhibit 7:
                                                                                                                 … as well as China
                        40
                                                                                        70
                        35                                                              66
                     (% of GDP)  30                                                          (%)
                        25                                                              62
                        20                                                              58
                        15                                                              54
                          1960      1970      1980      1990     2000      2010      2020
                                  China investment rate (% of GDP)  China working age population share (RHS)
                           Source: UN, Nuvama Research
                           Note: Working age population from 15–64 years
                                                                                                                            51
     	
