
Page 88 - Nuvama | IC Report 2023
P. 88
• MANUFACTURING • NEW ENERGY • URBANISATION • CONSUMPTION PREMIUMISATION • EQUITY SAVINGS CULT
1800 1695 1693
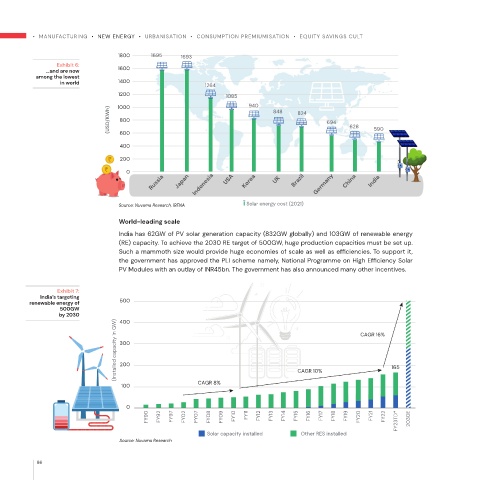
Exhibit 6:
…and are now 1600
among the lowest
in world 1400 1264
1200 1085 940
(USD/KWh) 1000 848 824 694 628 590
800
600
400
200
0
Russia Japan Indonesia USA Korea UK Brazil Germany China India
Source: Nuvama Research, IRENA Solar energy cost (2021)
World-leading scale
India has 62GW of PV solar generation capacity (832GW globally) and 103GW of renewable energy
(RE) capacity. To achieve the 2030 RE target of 500GW, huge production capacities must be set up.
Such a mammoth size would provide huge economies of scale as well as efficiencies. To support it,
the government has approved the PLI scheme namely, National Programme on High Efficiency Solar
PV Modules with an outlay of INR45bn. The government has also announced many other incentives.
Exhibit 7:
India’s targeting
renewable energy of 500
500GW
by 2030 400
(Installed capacity in GW) 300 CAGR 16% 165
200
100 CAGR 8% CAGR 10%
0
FY90 FY92 FY97 FY02 FY07 FY08 FY09 FY10 FY11 FY12 FY13 FY14 FY15 FY16 FY17 FY18 FY19 FY20 FY21 FY22 FY23TD* 2030E
Solar capacity installed Other RES installed
Source: Nuvama Research
86