
Page 118 - Nuvama | IC Report 2023
P. 118
• MANUFACTURING • NEW ENERGY • URBANISATION • CONSUMPTION PREMIUMISATION • EQUITY SAVINGS CULT
15000
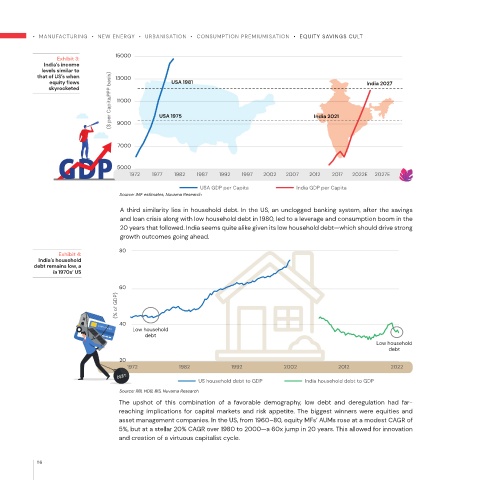
Exhibit 3:
India’s income
levels similar to
($ per Capita,PPP basis) 11000 USA 1975 India 2021
that of US’s when 13000
equity flows USA 1981 India 2027
skyrocketed
9000
7000
5000
1972 1977 1982 1987 1992 1997 2002 2007 2012 2017 2022E 2027E
USA GDP per Capita India GDP per Capita
Source: IMF estimates, Nuvama Research
A third similarity lies in household debt. In the US, an unclogged banking system, after the savings
and loan crisis along with low household debt in 1980, led to a leverage and consumption boom in the
20 years that followed. India seems quite alike given its low household debt—which should drive strong
growth outcomes going ahead.
80
Exhibit 4:
India’s household
debt remains low, a
la 1970s’ US
60
(% of GDP)
40
Low household
debt
Low household
debt
20
1972 1982 1992 2002 2012 2022
US household debt to GDP India household debt to GDP
Source: RBI, HDB, BIS, Nuvama Research
The upshot of this combination of a favorable demography, low debt and deregulation had far-
reaching implications for capital markets and risk appetite. The biggest winners were equities and
asset management companies. In the US, from 1960–80, equity MFs’ AUMs rose at a modest CAGR of
5%, but at a stellar 20% CAGR over 1980 to 2000—a 60x jump in 20 years. This allowed for innovation
and creation of a virtuous capitalist cycle.
116