Page 107 - Nuvama | IC Report 2023
P. 107

INDIA: THE 5D ADVANTAGE


                       Rising incomes and affordability
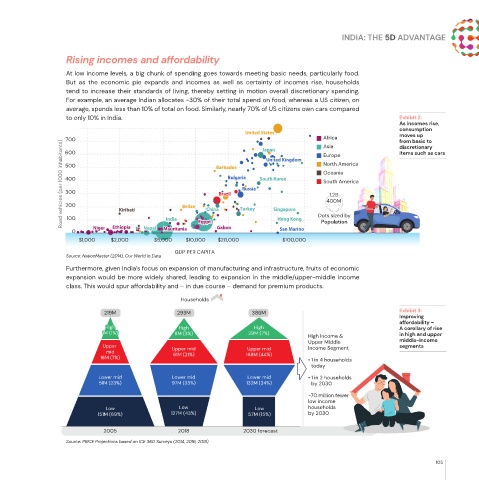
                       At low income levels, a big chunk of spending goes towards meeting basic needs, particularly food.
                       But  as  the  economic  pie  expands  and  incomes  as  well  as  certainty  of  incomes  rise,  households
                       tend to increase their standards of living, thereby setting in motion overall discretionary spending.
                       For example, an average Indian allocates ~30% of their total spend on food, whereas a US citizen, on
                       average, spends less than 10% of total on food. Similarly, nearly 70% of US citizens own cars compared
                       to only 10% in India.                                                                     Exhibit 2:
                                                                                                                 As incomes rise,
                                                                                                                 consumption
                                                                        United States                            moves up
                       700                                                  Japan            Africa              from basic to
                      Road vehicles (per 1000 inhabitants)  500  Belize  Barbados  Russia  South Korea  North America
                                                                                             Asia
                                                                                                                 discretionary
                       600
                                                                                                                 items such as cars
                                                                                             Europe
                                                                             United Kingdom
                                                                                             Oceania
                                                                   Bulgaria
                       400
                                                                                             South America
                       300
                                                                Brazil
                                                                                              1.2B
                                                                                              400M
                       200
                                                             China
                                     Kiribati
                       100
                                                  India
                                                                                Hong Kong
                                                                                            Population
                                                                                 San Marino
                         0    Niger  Ethiopia  Nepal  Mauritania  Egypt  Gabon  Turkey  Singapore  Dots sized by
                           $1,000  $2,000      $5,000  $10,000  $20,000           $100,000
                                                     GDP PER CAPITA
                       Source: NationMaster (2014), Our World in Data
                       Furthermore, given India’s focus on expansion of manufacturing and infrastructure, fruits of economic
                       expansion would be more widely shared, leading to expansion in the middle/upper-middle income
                       class. This would spur affordability and – in due course – demand for premium products.
                                                      Households
                                 219M                293M                386M                                    Exhibit 3:
                                                                                                                 Improving
                                                                                                                 affordability –
                                  High                High                High                                   A corollary of rise
                                 1M (1%)             8M (3%)            29M (7%)                                 in high and upper
                                                                                         High Income &
                                                                                         Upper Middle            middle-income
                                 Upper              Upper mid           Upper mid        Income Segment          segments
                                  mid
                                16M (7%)            61M (21%)           168M (44%)
                                                                                         • 1 in 4 households
                                                                                          today
                                Lower mid           Lower mid           Lower mid        • 1 in 2 households
                                51M (23%)           97M (33%)           132M (34%)         by 2030
                                                                                         ~70 million fewer
                                                                                         low income
                                  Low                 Low                 Low            households
                                151M (69%)          127M (43%)          57M (15%)        by 2030
                                 2005                2018              2030 forecast
                       Source: PRICE Projections based on ICE 360 Surveys (2014, 2016, 2018)

                                                                                                                           105
   102   103   104   105   106   107   108   109   110   111   112