
Page 101 - Nuvama | IC Report 2023
P. 101
INDIA: THE 5D ADVANTAGE
Looking ahead, given the tailwinds from de-globalisation and deregulation, topped up on the base
of a favourable demography, India can clock rapid economic growth and optimal employment. With
companies across the world looking to diversify supply chains away from China and an increasing
number of nations scrambling to secure their energy and defence, India is in a sweet spot to benefit
from these tectonic shifts.
Furthermore, the government’s Make in India campaign plays right into this opportunity while the Self-
reliant India program (Atmanirbhar Bharat Abhiyan) encourages select areas of import substitution so Rural areas
as to boost domestic manufacturing. lack access to
adequate health
Therefore, India’s favourable demography combined with tailwinds emanating from a global and education
manufacturing shift can generate tremendous employment opportunities and will have a strong pull infrastructure;
effect on workers from rural areas. As a result, the rate of urbanisation shall rise. This in turn shall lift this is a key
efficiency and fuel economic activity further. factor pushing
people to migrate
Surely, urban living has its own set of disadvantages such as cramped housing, lack of open spaces, to urban areas
higher pollution levels, relatively high crime rates and so on, but ample opportunities for gainful
employment act as the single-biggest pull factor that attract people to migrate to cities.
On the other hand, rural areas lack access to adequate health and education infrastructure and
entertainment facilities, not to mention other deficiencies in public infrastructure. These act as big
push factors forcing people to migrate from rural areas.
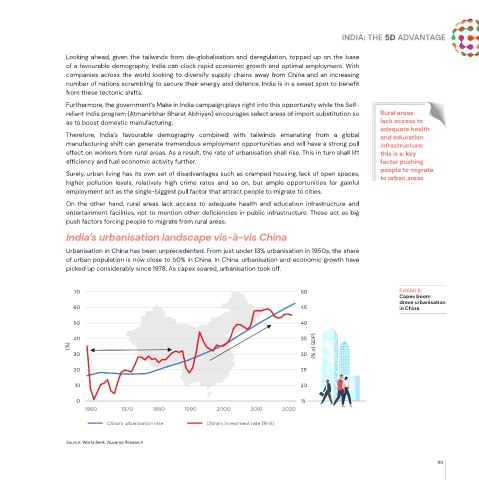
India’s urbanisation landscape vis-à-vis China
Urbanisation in China has been unprecedented. From just under 13% urbanisation in 1950s, the share
of urban population is now close to 50% in China. In China, urbanisation and economic growth have
picked up considerably since 1978. As capex soared, urbanisation took off.
70 50 Exhibit 6:
Capex boom
drove urbanisation
60 45 in China
50 40
40 35
(%) (% of GDP)
30 30
20 25
10 20
0 15
1960 1970 1980 1990 2000 2010 2020
China’s urbanisation rate China’s investment rate (RHS)
Source: World Bank, Nuvama Research
99